Archive
How to get the voice of your customer (VOC)?
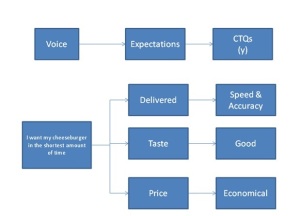
Step 1: What is Critical To Quality (CTQ)
- Voice: The customer need
- Expectation: The category of the need expressed in the “Voice”
Example: CTQ for Steve’s Hamburger Stop
Step 2: Identifying Cause & Effect Analysis
- Cause Factor: The “inputs(s) the company controls to drive the performance of the CTQ
Your customer is why your business is successful. Utilizing tools such as Voice of Customer (VOC), Critical To Quality (CTQ) & Cause & Effect (C&E) Analysis you can provide them your services on their voice and expectations. This facilitates Customer Satisfaction!!


Why Root Cause Analysis?
Root cause analysis helps identify what, how and why something happened, thus preventing recurrence.
Root causes are underlying, are reasonably identifiable, can be controlled by management and allow for generation of
recommendations.
Root cause analysis (RCA) is a process designed for use in investigating and categorizing the root causes of events with safety, health,
environmental, quality, reliability and production impacts. The term “event” is used to generically identify occurrences that produce or have the potential to produce these types of consequences.
Definition
Although there is substantial debate on the definition of root cause, we use the following:
- Root causes are specific underlying causes.
- Root causes are those that can reasonably be identified.
- Root causes are those management has control to fix.
- Root causes are those for which effective recommendations for preventing recurrences can be generated.
Root causes are underlying causes. The Practitioners goal should be to identify specific underlying causes. The more specific the Practitioners can be about why an event occurred, the easier it will be to arrive at recommendations that will prevent recurrence.
Four Major Steps
The RCA is a four-step process involving the following:
- Data collection.
- Causal Effect Diagram
- Root cause identification.
- Recommendation generation and implementation.
Step 1 —Data collection. The first step in the analysis is to gather data. Without complete information and an understanding of the
event, the causal factors and root causes associated with the event cannot be identified. The majority of time spent analyzing an event is spent in gathering data.
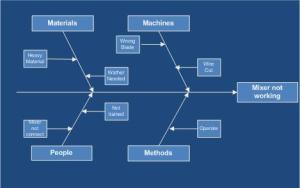
Step 2 —Causal Effect Diagram. Causal Effect Diagrams help you to think through causes of a problem thoroughly. Their major benefit is that they push you to consider all possible causes of the problem, rather than just the ones that are most obvious.
Identifying the Likely Causes of Problems Related variants: Fish or Fishbone Diagrams, and Ishikawa Diagrams
Step 3 —Root Cause identification. After all the causal factors have been identified, the investigators begin root cause
identification. This step involves the use of a decision diagram called the Root Cause Map to identify the underlying reason or reasons for each causal factor.
Step 4 —Recommendation generation and implementation. The next step is the generation of recommendations. Following identification of the root causes for a particular causal factor, achievable recommendations for preventing its recurrence are then generated.


